Network Monitoring Tool
Odysseus
Preface
One of my favourite pastimes besides working with electronics projects is the setup, management, and configuration of servers. As such I have set up a number server in my home in order to run a number of services, some for fun, while others provide a large number of useful services. Not only does this allow me to access my work from anywhere in the house, but it also provides an exceptional learning experience for anyone interested in networking, and communications between systems. One issue however, that I have had with maintaining servers is keeping track of the large number of network addresses. This was partially dealt with through the use of hostnames, but still required that I memorize a number of ports. Eventually I decided that rather than memorize all of these details, I would rather design a tool that automates the process. Odysseus (name such for relatively obvious reasons) can automatically scan a predefined range of IP addresses, searching for user defined ports and services, and provides a user friendly interface for accessing all of these web pages.

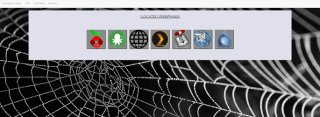
Due to my experience working with bootstrap, and the fact that I utilize a number of mobile devices for server management, I decided to go with a mobile friendly approach towards designing Odysseus. The design was made to be very simplistic, as I have found through experience that less complex designs tend to be easier on the eyes and detract less from the important material. As such, the main page of Odysseus is populated by nothing more than the list of found web servers. Clicking on one of these images will automatically send you to the relevant web page.
The actual programming end of Odysseus began with no more than a home page with no links yet available and all data was being served by a basic NodeJS express web server that would handle standard static web serving. Once a webserver was implemented the Node back end was developed to make use of a package called EvilScan, which takes parameters in the vein of IP's and Ports and returns anything matching the parameters in a JSON format. The server then utilizes the returned list in order to create two separate lists; a list of all IPs containing all IPs found by EvilScan, and a list of all confirmed hosts to which Odysseus will redirect. The web server then would parse this information in order to generate links for each web page.
With this initial setup and design being completed, it was time to begin adding features. One of the first was to add thumbnails for the webservers; this was done easily enough through the use of a JSON file containing a list of definitions specifying which ports are used for which web service. Using this, the server would attach a list of all thumbnails that were relevant to any one web server to the description of the web server before sending it to the web page. Using this information, the web server attaches the image to the appropriate link, and adds a service name below the server name. This allows for easier identification of which web server is which, even if multiple are hosted on a single machine.

Up until this point all settings for the odysseus server were set manually using JSON files on the server host machine. As this is impractical I began the design of a settings page, where a user can input their parameters and edit server settings without ever having to alter files on the actual server. This started with the easiest of settings to modify, the IP range. The user would simply have to enter a start IP and end IP, and then click the submit button in order to configure the server to scan that range. Following this setting, the domain and ignore host parameters were added; these settings strip the domain name from server FQDN's if necessary, and will omit the Odysseus host server from appearing in the list of servers, respectively.
Now that the easy settings have been implemented we must move onto the more difficult settings to modify. First is the list of hosts to omit or force; this section allows a user to prevent any selected currently active host from appearing in the list of hosts. However if they wish to block a DHCP host, they can oit the host by its hostname using the input below the selection box. These settings can be confirmed using the submit button, and the selection box will be updated. Forcing hosts has more to do with the way Odysseus was designed; Odysseus will only automatically provide links to servers with hostnames, ignoring any that do not have one. This is due to the fact that many devices that lack hostnames likely arent going to host web pages you care much about. If however, the opposite is true, then upon selecting one of these hosts its status will be changed from ignored to forced, allowing it to appear in the server list, as well as giving it its IP as a name for easy identification.
The ports to scan selction box works in a similar fashion to the hosts box, allowing you to remove ports by selecting them from the box and submitting. However, adding ports is done by entering their port number and the attached service separated by a hyphen and submitting. This will add the port and service if an entry for that port does not already exist, otherwise it will override the pre-existing entry with the new details. One major feature addition that was recently implemented for this section was the ability to use multiple ports for a single web service, however each port can only have one unique service attached to it.
Adding to the systems ability to redirect you to a servers web page, the host redirect section allows you to specify for any currently active server a location to which Odysseus should link the user rather than the default page. This is done by entering the redirect you want into the input box below the selection menu and submitting. As with previous control menus, any hosts that have already been added will have their previous redirects overwritten, and the redirects may be removed by selecting those you no longer wish to use from the menu, and submitting.
The final menu on this page (not pictured) is a menu listing all currently existing thumbnail images, allowing you to delete those you do not need, or overwritinf/uploading new ones using the button below the selection menu. This menu is used in mucht he same way as the other selection menus, however there is some special functionality built in, not to the menu, but to the thumbnail naming convention itself. Any thumbnail uploaded can be named in the form of "[Service].png", which will utilise the port list in order to determine which thumbnail to apply to which link. There is another naming convention, in the form of "[Service] - [Server].png" which allows you to specify specific images for different servers, and these thumbnails will always take priority over any others. This allows you to give the links more personality, and provides for easier differentiation from servers that run on the same ports as each other.
Once all nput settings match your preferences, you simply have to press the update button, and the current config will be uploaded to the server, following which the server will rescan the network using the newly specified configuration settings. The server will dropdown a popup showing the current status of the network scan, this menu is a simple modal that is also used to notify the user of configuration errors when attempting to upload an invalid configuration. With this, the settings page is completed, and is ready to be used to allow the server to be configured remotely, however if wished, the user can still modify the servers settings by modifying the JSON files on the server.

The inital goal of Odysseus was simply to scan for, and link to web servers, however I decided that since this page was going to act as a main page for the entire network, it would be useful for it to have the ability to show the current status of the servers on the network. This was achieved through the use of Nodes built in package that allows you to run system commands, and uses the ruptime command from the rwho package in order to collect uptime information from all server on the network that are running rwhod (the rwho daemon), and then populates a table with this data in order to make it easy to see server status'. The information provided includes, the server name, status, the number of active users, system uptime, and unix CPU times, allowing you to identify whether a server is online, under heavy load, or other relevant information. Note however, that this feature will only work if the host server currently has rwho installed, if not an error modal pops up to notify the user that rwho is neccessary for the use of the monitoring tool, and it is disabled again.
Conclusion
Through the use of the odysseus tool, I have been able to more easily manage my local servers, and have not yet run into issues with any forgotten server details. It has also enabled me to keep an eye on the status of my servers, allowing me to maintain better uptimes and all around useability. Due to this project being entirely code based I have decided to host it on GitHub, which has also allowed me to reach a wider audience in order to gauge interest, and to help me find issues. Feel free to check out the code base at Odysseus.
ASCIIPlay