Arduino Based Datalogger
Arduino Ammeter
Preface
I've recently been working on building a small arduino based datalogger that can be left alone for many days on end and give me information about the weather in my area. This project has been requiring that I do alot of work on the front of power optimizations and collecting information about my batteries and conversion circuitry. One major issue that I ran into however was that a standard multimeter is terrible at reading rapidly fluctuating values, and wont give a good picture of my circuits current draw while running. The solution that I came up with then was to use an arduino based system to print rapidly collected data to a serial plotter in order to give me a better view of how the current draw changes while running my code. Do note however that this solution does have some issues, and would be better implemented with an oscilloscope if I had one. This circuit could also be iproved by using a high accuracy Op-Amp to provide an amplified signal from the voltage drop, which would in turn allow for a higher accuracy with a higher current allowance, however these can be expensive and hard to obtain, so I opted for a low cost approach.
Parts and Tools Used
- 1x Attiny85 microcontroller
- 2x 1KΩ resistors
- 1x 47Ω 5W resistor
- 2x Tactile switches
- 1x DIP8 Socket
- 1x Tactile Switch
- Male headers
- Insulated & uninsulated copper wire
- Wire strippers
- Soldering iron

This project began as a mostly mathematical one; where in calculations were performed in order to determine the resistor value to be used based on the required accuracy of measurement and required current flow. These equations were simple variations on Ohm's law, which stated that V = IR. By knowing the number of divisions on the arduino's ADC and the supply voltage, we can calculate that each division of the ADC is equivalent to a ~5mV change in measured voltage. Using this value, we can divide it by our intended accuracy range, in this case 100uA, in order to calculate the required resistor value for the circuit, in this case being ~50Ω. Due to the fact that this resistor will need to go in series with our circuit, it will limit our maximum current draw, in this case to 100mA, which for the purpouses of working with an arduino will be more than sufficient as long as we dont run too many devices off of it. Also keep in mind that the resistor will need to be able to dissipate the power going through it, in this case the maximum power across the resistor wil be ~0.5W, but this will depend on the resistor value used and the supply voltage. Note that I used a 5W resistor, this was due to the fact that it was the only resistor of a close enough value that could handle more than 0.5W of heat dissipation.
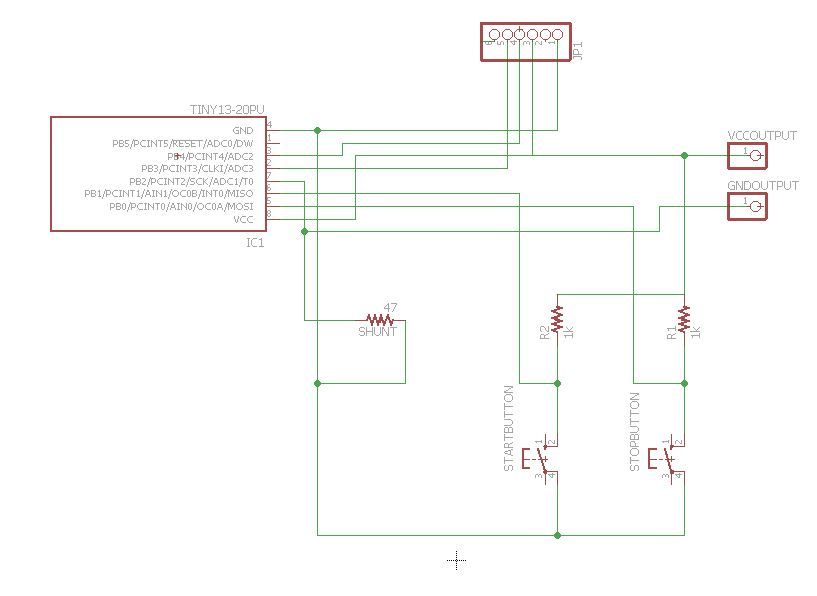
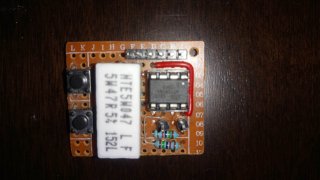
Once I had determined the operational range, and requirements of my circuit I proceeded to design a circuit that would meet the requirements. The used measurement device was an AtTiny85 in order to provide a reduced cost approach to solving this problem, while also allowing for a reduced footprint. The AtTiny has its digital pins 3 and 4 connected to a 6 pin FTDI header in order to provide serial data relaying to a computer that can then generate a graph based on the returned results. The circuit is powered through the FTDI header, and powers the circuit to be measured through it as well (Due to the resistor limiting current we don't have to worry about exceeding the USB maximum). Then the shunt resistor was connected between the FTDI ground and the ground going to the circuit, note that it is recommended to measure current from the ground in order to prevent the risk of a potential being generated across our arduino. The output ground connection is also connected to the AtTiny's analog pin 1 in order to measure the voltage drop across the resistor. Two tactile buttons were also added to the two remaining pins of the AtTiny with pull up resistors in order to start and stop the serial output to allow for ease of use.
With a circuit designed programming was the next task, where in a high speed serial output needed to be generated in order to get a better view of circuit current draw. Due to the AtTiny lacking hardware serial support we will need to make use of the software serial library, which has the consequence of forcing us to use an AtTiny85 due to it massively increasing our program spave requirements. This is not a major issue however, and it allows us to customise which pins we use for serial communication, due to this we can use digital pins 3 and 4 in order to keep the MCU in line with the FTDI header. We also set a variable in the code for a delay period between current measurements in order to allow for changes through the serial monitor in future, however at this time it can be changed manually. The main loop uses very simple logic, if the start and we are currently reading, then multiply the analog reading on the currentPin by the nuber of millivolts per division in order to get a reading of the voltage drop across the shunt in milliVolts. This value is then multipled by 1000 to get a voltage drop in volts, and is divided by the measured value of the resistor in order to return a value in milliAmps.

By using a serial monitor you can read the values returned over serial, or you can plot the values using either a third party program or the arduino serial plotter. The generated plot will show milliAmps, and using a computer you can apply a timescale to the horizontal axis in order to determine power consumption over time. Using these graphs you can more easily determine why and where power is being consumed by your program, or other circuitry, and it allows for more accurate and effective debugging. Using this tool has made for a decent substitution in place of an oscilloscope as it allows me to collect relatively accurate power draw information, and when combined with a multimeter it allows for a very useable platform to measure, track, and reduce power consumption.

Future plans for this project include the production of a proper printed PCB of the design, as well as providing a 6 pin female header on the other end of the board allowing the device to be used in between an FTDI programmer and boards that have FTDI headers. To this end, I also plan to look into using the AtTiny in order to forward serial information from the secondary device, however I am at this time unsure as to how best go about this. Provided is a board layout design for the current version of the board that can be used with any device connected to the output pins. You can disregard the fact that the MCU in the eagle schematic is the AtTiny13, as the pinouts are the same. As can be observed however, the circuit is so simple that it can likely be more easily made with standard proto board as most connections are directly in line with one another.
Conclusion
Despite this circuit initially being thought of as a quick and simple solution to the problem of quickly sampling and graphing current draw of electronics, it quickly became apparent that it is in fact significantly useful, and as such warranted proper construction, design, and implementation in order to make my project construction and testing easier and more effective. As such, I would highly recommend this board to any electronics hobbyist who needs a quick and simple way of measuring and plotting device current draw, as it makes for a very helful tool, especially when diagnosing hardware faults.
Binary Clock